Difference between revisions of "JasperReportExample"
doc>Kaja |
Samonachova (talk | contribs) |
||
| (One intermediate revision by one other user not shown) | |||
| Line 5: | Line 5: | ||
= {{Title|JaspersoftStudio|Jaspersoft Studio Installation}} = | = {{Title|JaspersoftStudio|Jaspersoft Studio Installation}} = | ||
Download the Jaspersoft Studio software package. To do that follow the link below and choose an installer suitable for your operating system. | Download the Jaspersoft Studio software package (!version 6.4.0). To do that follow the link below and choose an installer suitable for your operating system. | ||
https://sourceforge.net/projects/jasperstudio/files/JaspersoftStudio-6.4.0/ | |||
= {{Title|Template|Report Template. Bands Description}} = | = {{Title|Template|Report Template. Bands Description}} = | ||
Latest revision as of 13:47, 29 November 2023
Illustration of Development of a Report on BP Example Data
RunaWFE Free Workflow System (BPMS) Version 4.5.0
© 2003 - 2015, Consulting Group Runa
© 2015 - 2026, "Process Technologies" Ltd, this document is available under GNU FDL license. RunaWFE Free is an open source system distributed under a LGPL license (http://www.gnu.org/licenses/lgpl.html).
# Jaspersoft Studio Installation
Download the Jaspersoft Studio software package (!version 6.4.0). To do that follow the link below and choose an installer suitable for your operating system. https://sourceforge.net/projects/jasperstudio/files/JaspersoftStudio-6.4.0/
# Report Template. Bands Description
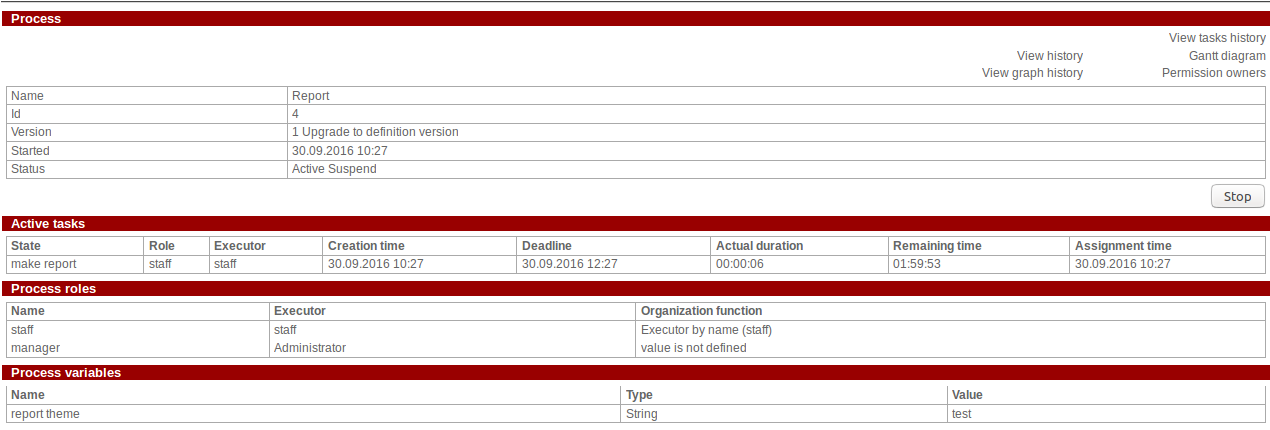
Let us create a report corresponding to the properties page of the started process example.
The report will contain general information about the process (definition name, example number, version, when started, status), section of active tasks, swimlanes and variables.
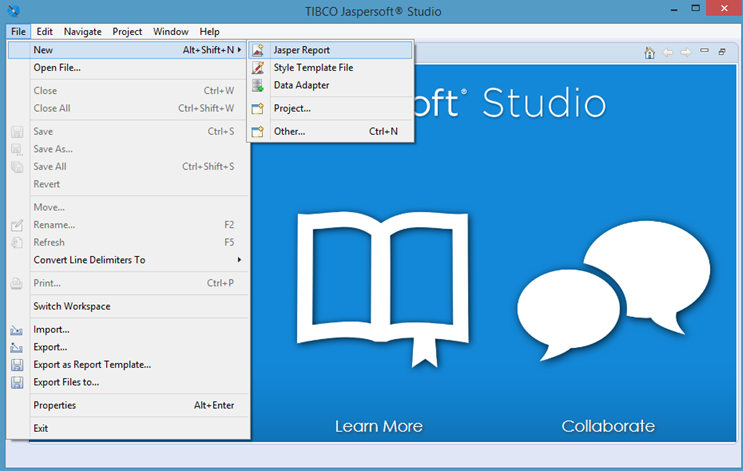
Open the installed Jaspersoft Studio and create a new report.
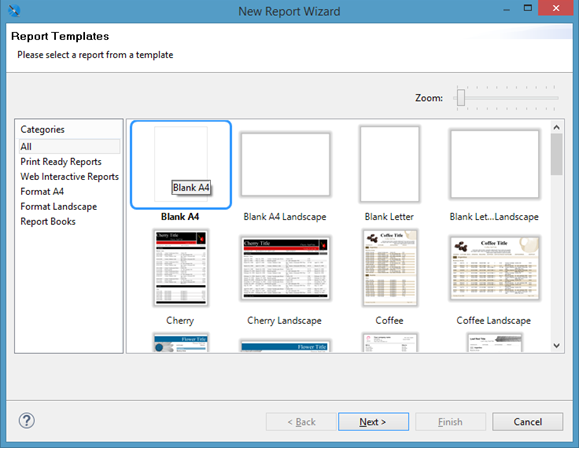
Select “Blank A4” template and press Next.
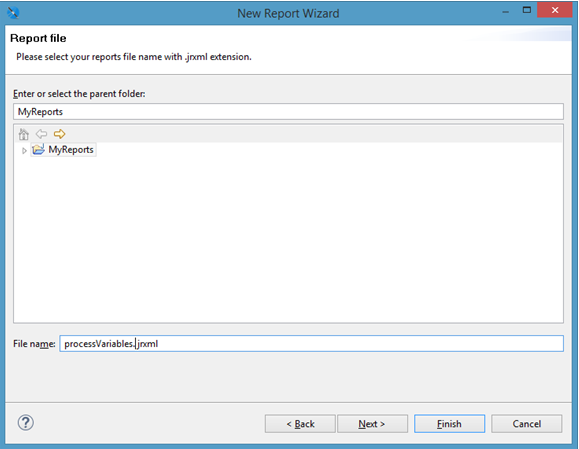
Enter the report name, for instance, “processVariables”, and press Finish.
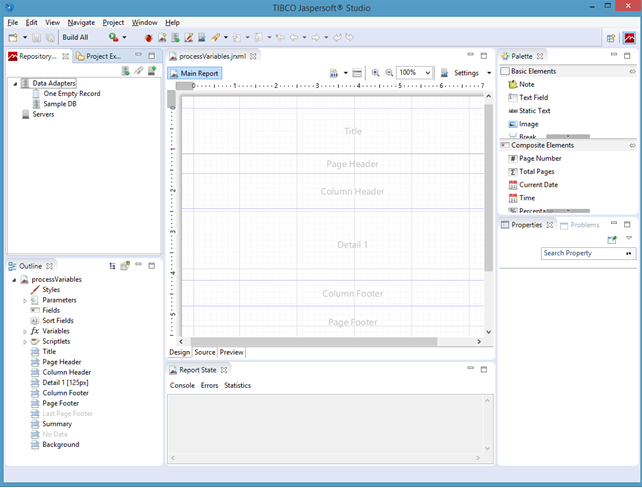
A Jaspersoft Studio workspace will open.
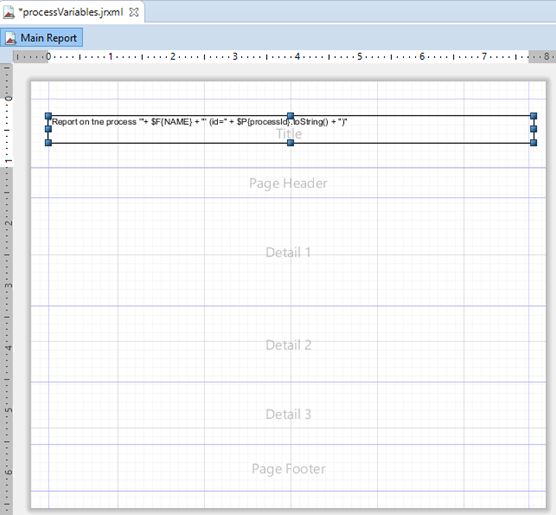
The selected “Blank A4” template consists of the following bands:
- “Title” - report title, displayed only on the first page
- “Page Header” - section displayed on each page
- “Column Header” - displayed at the beginning of a report column. We won’t use this band, so left-click it with your mouse and press “Delete”.
- “Detail” - displayed for each entry in the dataset.
- “Column Footer” - a band to display data at the end of a report column. We won’t use it, so, delete it.
- “Page Footer” - a band to display data at the end of each page.
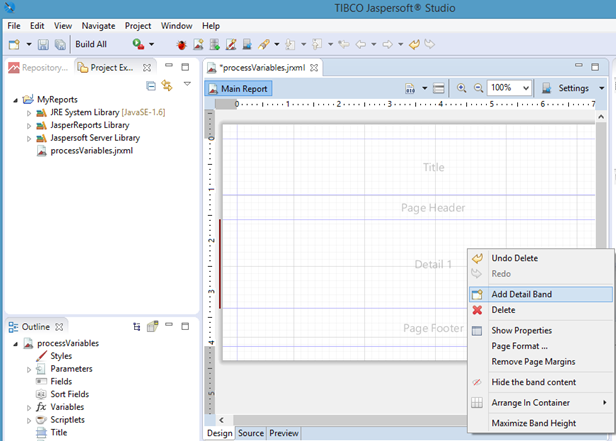
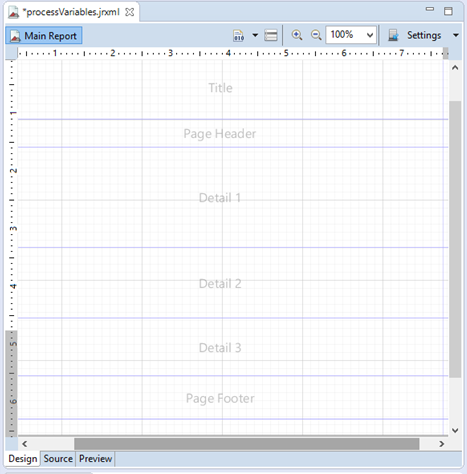
Add two more “Detail” bands to the report. To do that right-click the Detail band and select the option “Add detail band”.
Save the report (use the Ctrl+s key combination or the corresponding icon on the tools panel).
# Working on the Report Title
As an input value for report formation an Id of a BP example will be used.
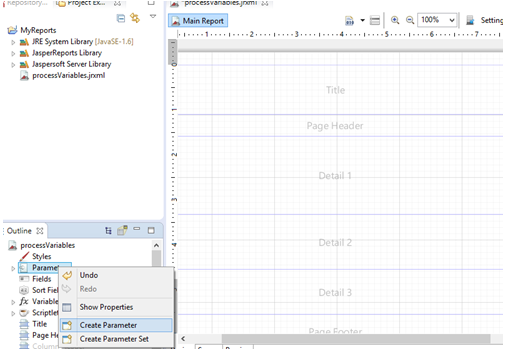
Go to the “Parameters” section and create a new parameter.
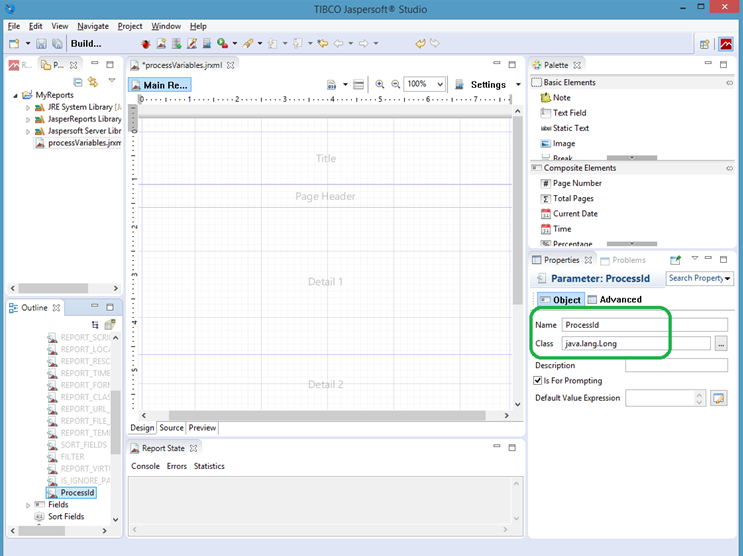
In “Properties” enter the parameter name - “ProcessId”
A BP example Id is an integer value, so set “java.lang.Long” as a class.
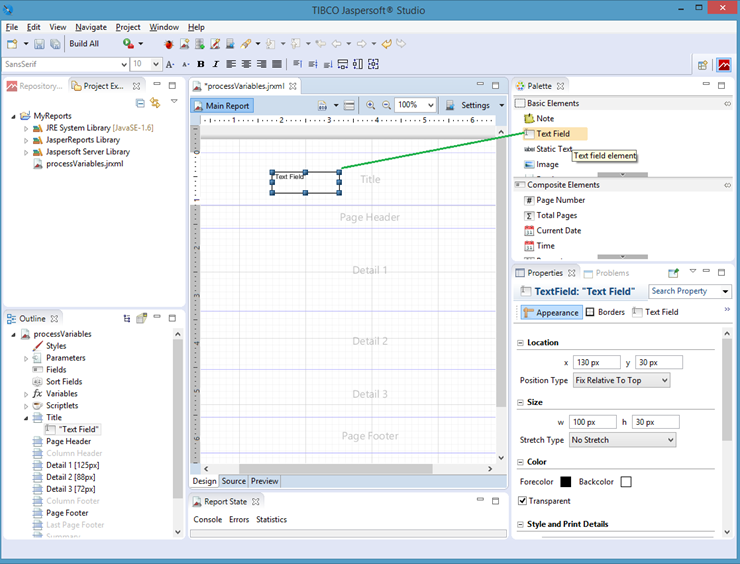
Go to the element palette and drag “Text field” into the Title band.
“Text field” is an element for displaying a dynamically generated string.
# Dataset
Let us display in the title: Process example Id and name of its definition.
To acquire this information you should configure a dataset.
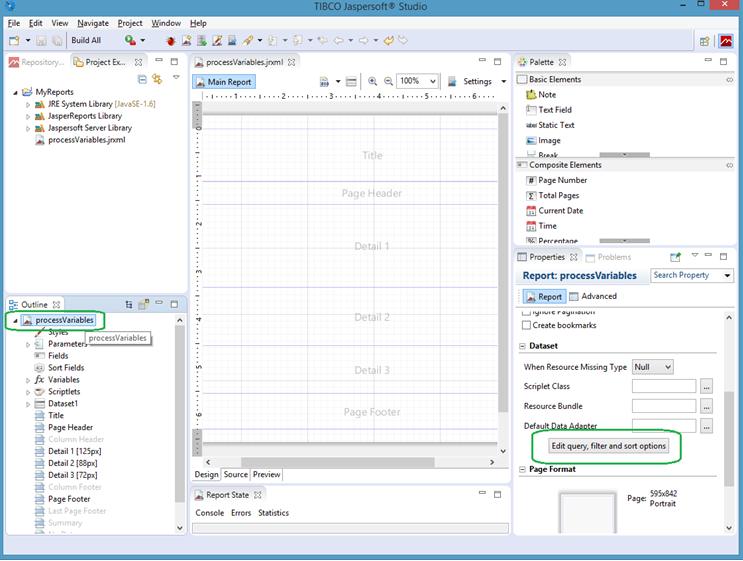
Click the root element “processVariables” on the “Outline” panel, a settings panel will open on the right.
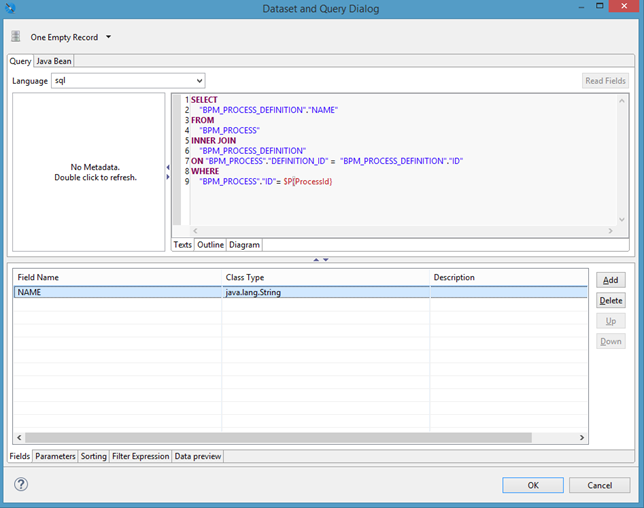
Press “Edit query, filter and sort” .
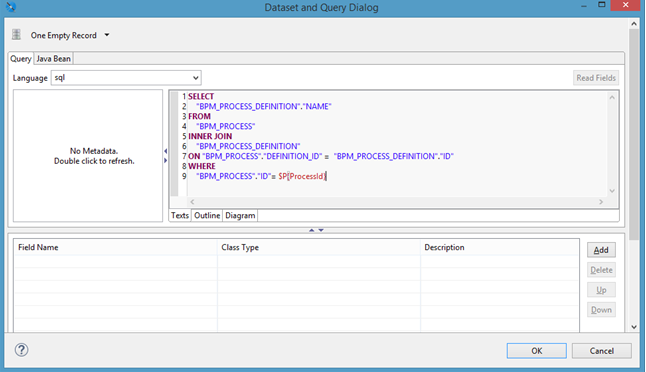
An SQL-query to obtain a process definition name by BP example Id looks like this:
SELECT
    "BPM_PROCESS_DEFINITION"."NAME"
FROM
    "BPM_PROCESS"
INNER JOIN
   "BPM_PROCESS_DEFINITION"
ON "BPM_PROCESS"."DEFINITION_ID" =  "BPM_PROCESS_DEFINITION"."ID"
WHERE
    "BPM_PROCESS"."ID"= $P{ProcessId}
Add this query to the “Texts” window.
The query returns a BP definition name. Press “Add” to add a new field. Enter the name – NAME, class type - “java.lang.String”
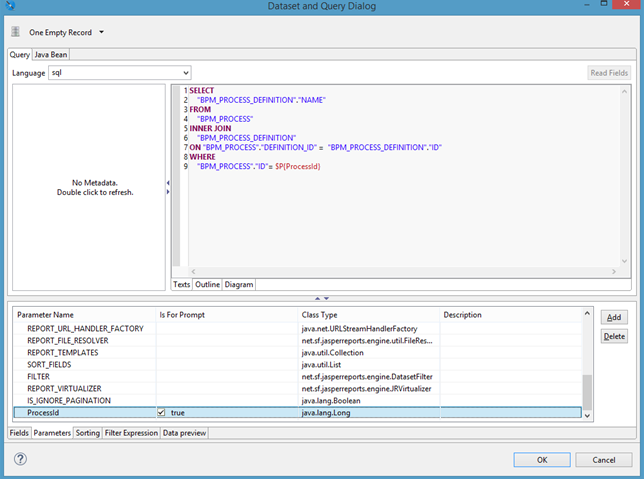
Go to the Parameters tab and define the ProcessId input value type as java.lang.Long.
Press OK.
# Expression for the Title
Now we can use the Name field we obtained as a result of the query in the “Text field” element we’ve added to the Title band.
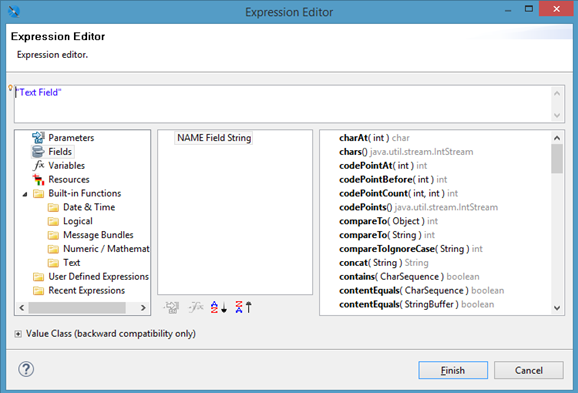
Double click it with your mouse, an expression editor window will open.
In Fields and Parameters the Name field and the ProcessId parameter we’ve added earlier should be present. We can use them in the expression.
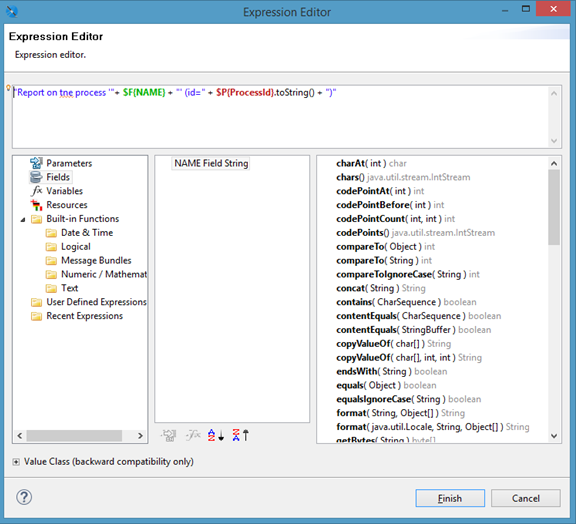
Enter the following expression:
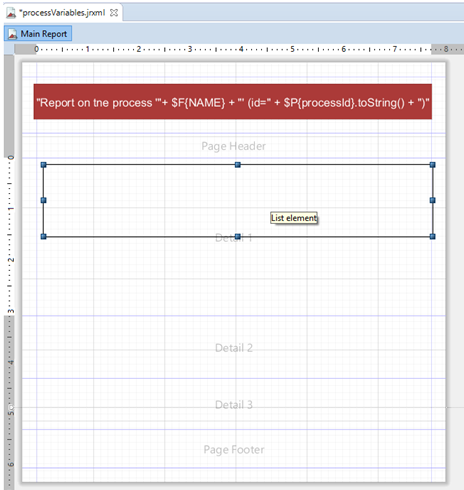
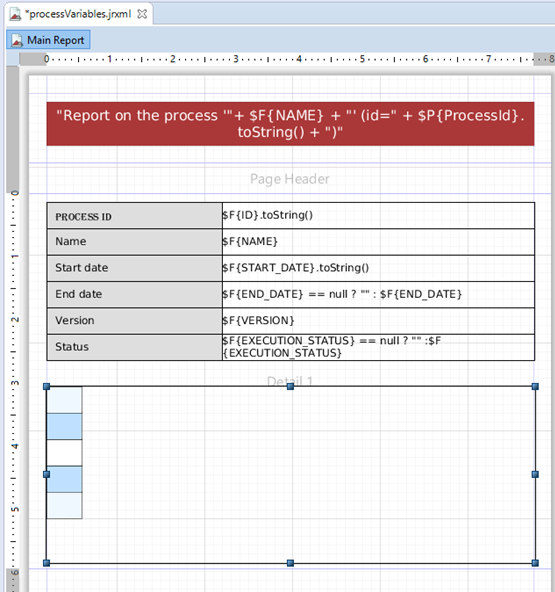
"Report on the process '"+ $F{NAME} + "' (id=" + $P{ProcessId}.toString() + ")"
To add a field or a parameter into the expression, mark it in the corresponding list and double click it.
To transform the ProcessId parameter (type Long) into a string form, use the toString() method.
Thus, a dynamically generated string, containing the ProcessId and its definition name will be displayed in the report title.
# Configuration of the Title Display Style
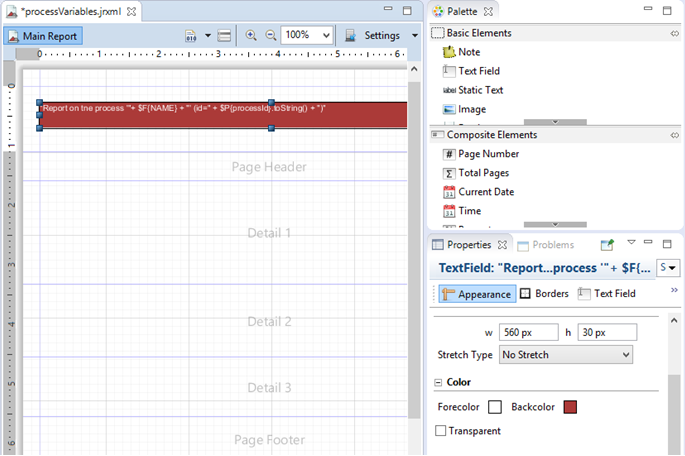
Highlight the title “Text field” and go to the Properties panel. Here you can set an element’s appearance or apply a style.
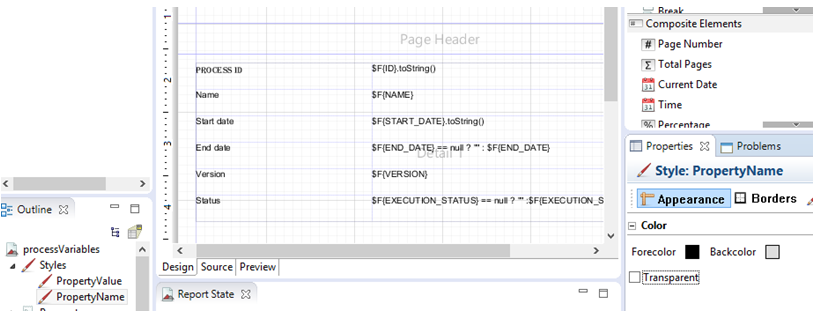
In the Color section set the text color (Forecolor) and the background color (Backcolor).
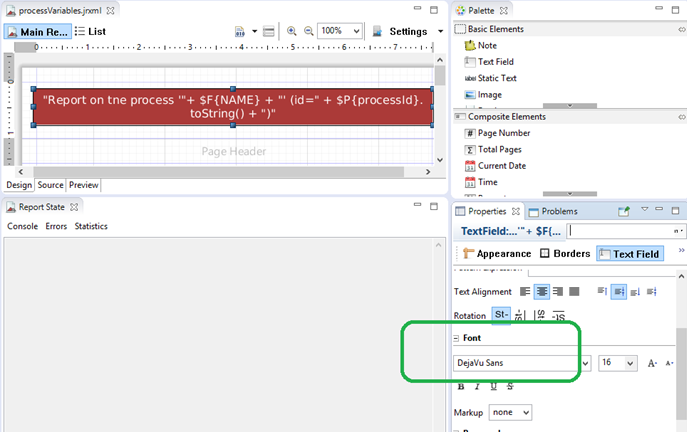
Use the “DejaVu Sans” font. It allows to display Cyrillic letters correctly in pdf reports.
Set the text alignment and its size.
Save the report.
# Band of Detailed Information on the Process Example
In the Detail1 band let us display the id, the name, the start date, the termination date, the version and the status of the process.
# Dataset
To obtain these values you should create a new dataset.
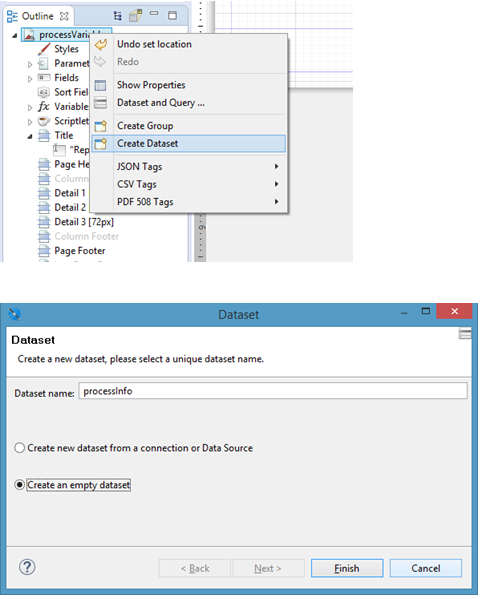
Go to the “Outline” window, open the context menu on the root element and select “Create DataSet”.
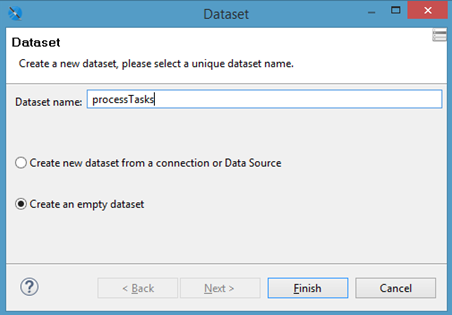
Give the dataset a name - “ProcessInfo”, create an empty dataset (an empty dataset option).
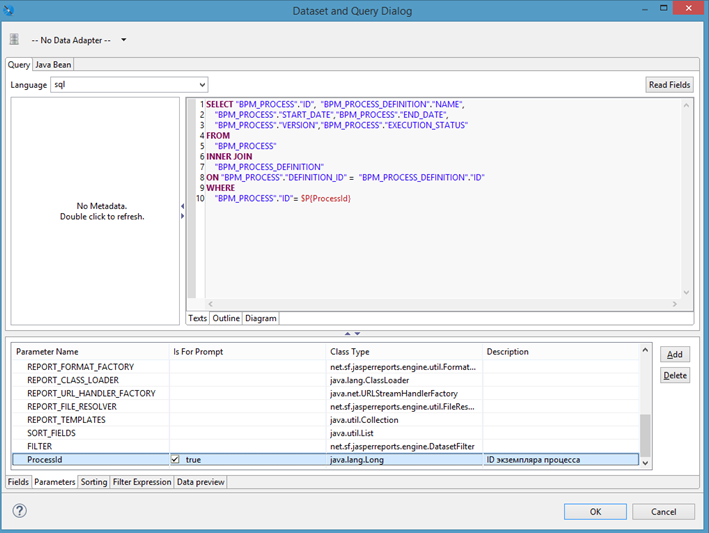
Go to the ProcessInfo settings and press “Edit query, filter and sort options”.
Add the following SQL query to the “Texts” section to obtain the process information by its Id.
SELECT "BPM_PROCESS"."ID", "BPM_PROCESS_DEFINITION"."NAME",
       "BPM_PROCESS"."START_DATE","BPM_PROCESS"."END_DATE",
       "BPM_PROCESS"."VERSION","BPM_PROCESS"."EXECUTION_STATUS"
FROM
       "BPM_PROCESS"
INNER JOIN
       "BPM_PROCESS_DEFINITION"
ON "BPM_PROCESS"."DEFINITION_ID" =  "BPM_PROCESS_DEFINITION"."ID"
WHERE
       "BPM_PROCESS"."ID"= $P{ProcessId}
Add the returned fields and set their class types as shown on the screenshot below.
# List Element
Let us display the process information by means of a List element.
To do that go to the graphic elements palette, mark List and drag it to the Detail1 band.
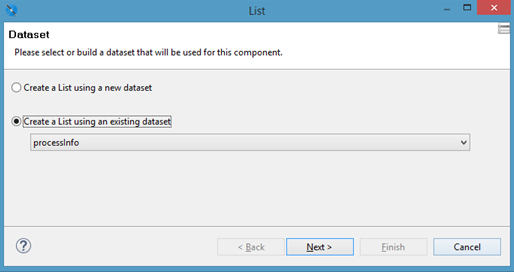
You will be offered to select a dataset.
Select ProcessInfo you have created.
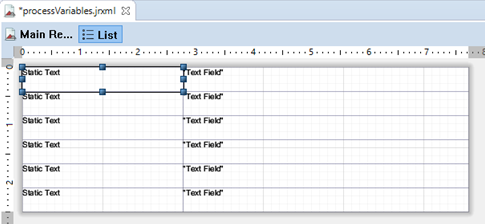
Double click the added List, a form for edition will open.
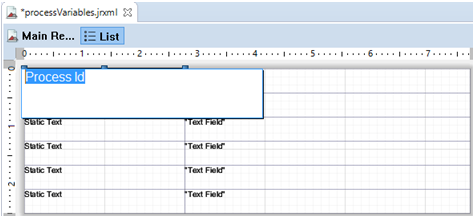
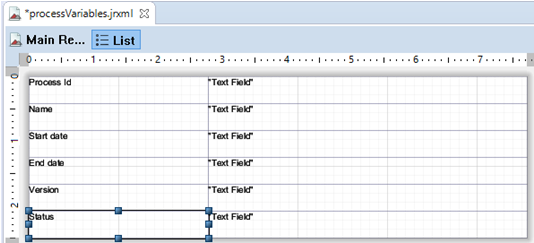
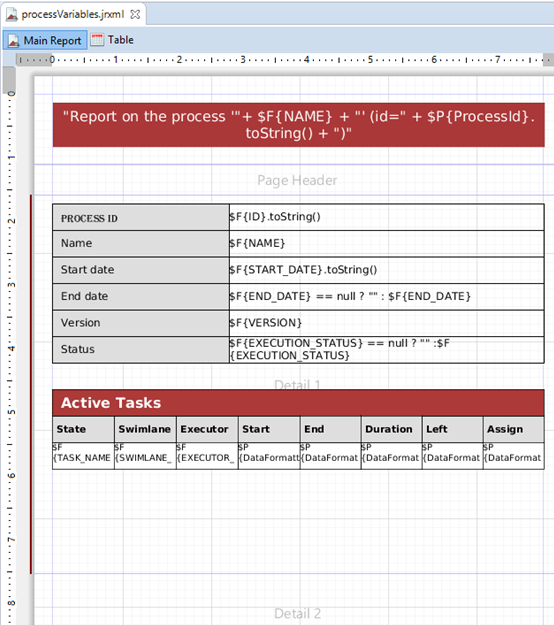
Place the already known “Static text” and “Text field” elements on the form as shown on the screenshot below.
Double click each added “Static text” and enter the names of process parameters.
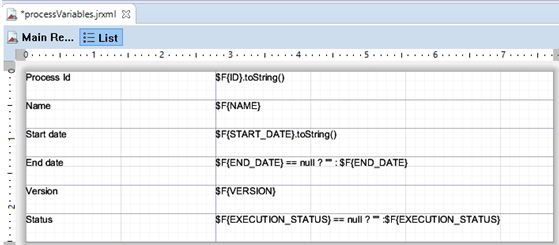
Add fields corresponding to the returned fields of the “ProcessInfo” query to the “Text field” elements.
Pay attention to phrases like:
$F{EXECUTION_STATUS} == null ? "" :$F{EXECUTION_STATUS}
In the example above status (EXECUTION_STATUS) verification is carried out, if the value is not assigned (equals NULL), then an empty string will be displayed“”, otherwise it will be status value.
Use such phrases in fields, that may be left unfilled. In this case these are “Status” and “Date of process termination”.
In the ProcessInfo query there is an output parameter “ProcessId”. You should change it into a List element.
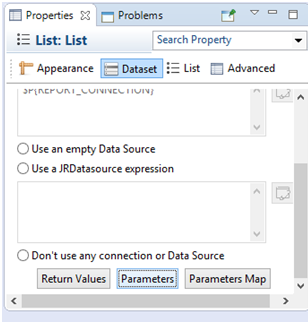
Highlight the List, enter its properties, go to the Dataset tab and press Parameters.
In the appeared window press Add and select the ProcessId parameter from the list.
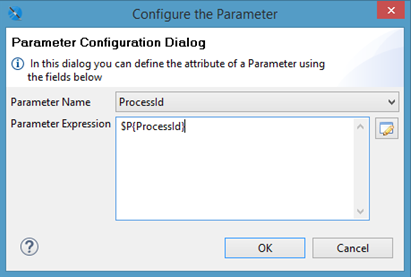
For this parameter set an expression like:
# Display Style Configuration
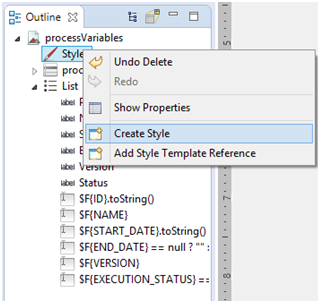
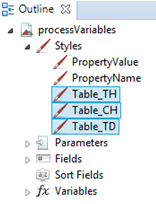
Click the Styles element of the “Outline” window and select “Create Style”
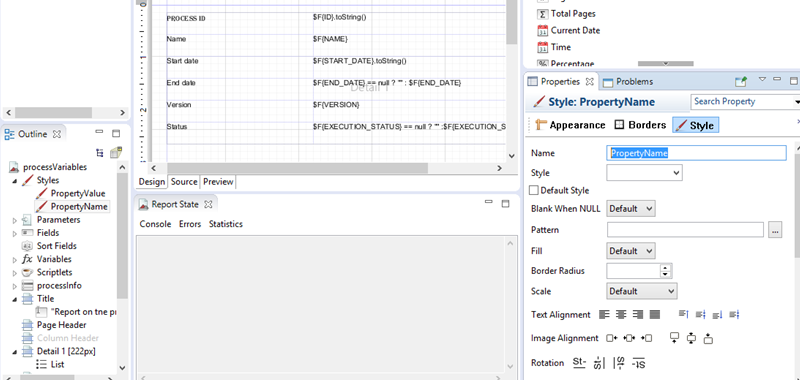
Create two styles:
1). PropertyName – for elements with names of properties
2). PropertyValue – for elements displaying values of properties
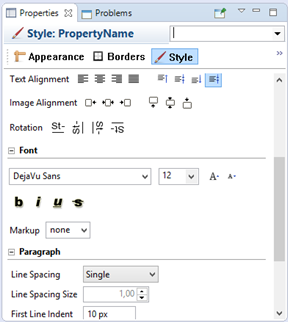
Highlight the created style and enter the Properties window.
Set background color, select a font (use DejaVu Sans) and its size.
Also you can set indents, text alignment, element borders, etc.
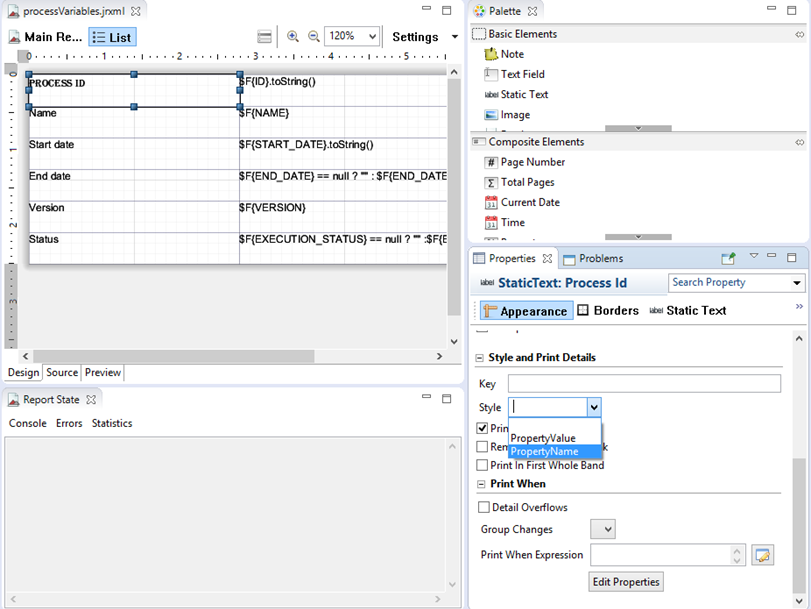
Next you should apply the created style to the elements responsible for output of a property’s name and its value in the List.
Mark the element, go to its properties, and on the “Appearance” tab select the corresponding style in a dropdown list.
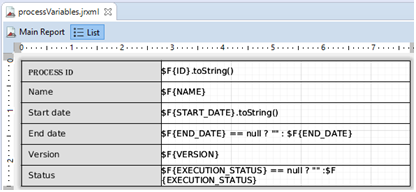
The List element will be displayed as follows:
# Active Tasks
Let us display the information on active tasks of the process in the form of a table with columns:
- State
- Swimlane
- Executor
- Date of creation
- Date of deadline
- Actual duration
- Time until deadline
- Time to take up for execution
# Dataset
Create a new dataset “ProcessTasks”.
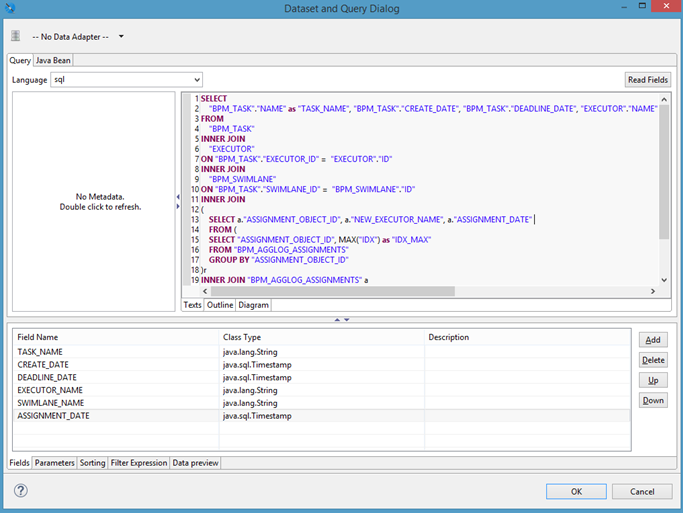
Use the following SQL query to obtain data on active tasks:
SELECT
       "BPM_TASK"."NAME" as "TASK_NAME", "BPM_TASK"."CREATE_DATE", "BPM_TASK"."DEADLINE_DATE", "EXECUTOR"."NAME" as "EXECUTOR_NAME",  "BPM_SWIMLANE"."NAME" as "SWIMLANE_NAME", q."ASSIGNMENT_DATE"
FROM
       "BPM_TASK"
INNER JOIN
       "EXECUTOR"
ON "BPM_TASK"."EXECUTOR_ID" =  "EXECUTOR"."ID"
INNER JOIN
       "BPM_SWIMLANE"
ON "BPM_TASK"."SWIMLANE_ID" =  "BPM_SWIMLANE"."ID"
INNER JOIN
(
       SELECT a."ASSIGNMENT_OBJECT_ID", a."NEW_EXECUTOR_NAME", a."ASSIGNMENT_DATE"
       FROM (
       SELECT "ASSIGNMENT_OBJECT_ID", MAX("IDX") as "IDX_MAX"
       FROM "BPM_AGGLOG_ASSIGNMENTS"
       GROUP BY "ASSIGNMENT_OBJECT_ID"
)r
INNER JOIN "BPM_AGGLOG_ASSIGNMENTS" a
ON a."ASSIGNMENT_OBJECT_ID" = r."ASSIGNMENT_OBJECT_ID" AND a."IDX" = r."IDX_MAX"
)q
ON "BPM_TASK"."ID" = q."ASSIGNMENT_OBJECT_ID"
WHERE
      "BPM_TASK"."PROCESS_ID"= $P{ProcessId}
Add return fields "TASK_NAME" , "CREATE_DATE", "DEADLINE_DATE", "EXECUTOR_NAME", "SWIMLANE_NAME", "ASSIGNMENT_DATE" and also “ProcessId” parameter.
As you can see from the query and from the structure of the return fields, kinds of data like actual duration or time until deadline are absent here. These kinds of data are calculated from current time and values of the “Date of creation”, (CREATE_DATE) and “Time until deadline” (DEADLINE_DATE) fields.
“Actual duration” = CREATE_DATE - “Current time”
“Time until deadline = “Current time” - DEADLINE_DATE
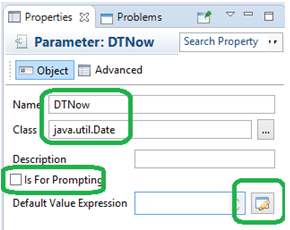
Create a new parameter DTNow, which will contain current time.
Use the “java.util.Date” class.
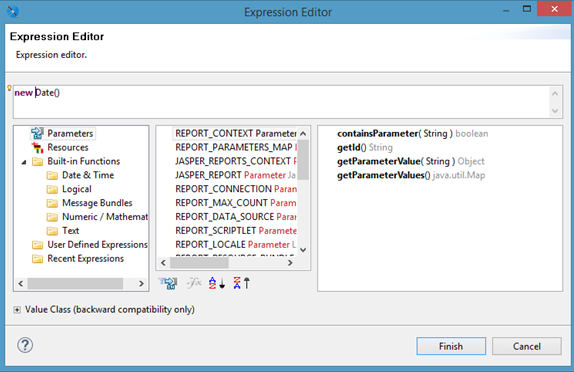
Click the icon opposite to “Default Value Expression” string.
Enter the following code:
new Date()
Option “Is For Prompting” shouldn’t be selected because such a parameter can not be used as an input parameter of a query.
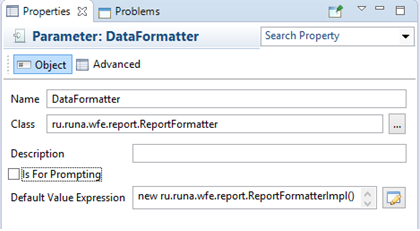
Besides, to calculate intervals between dates and also to bring dates to a common (displayable in RunaWFE) format, you should use one more parameter – DataFormatter. Its class is ru.runa.wfe.report.ReportFormatter.
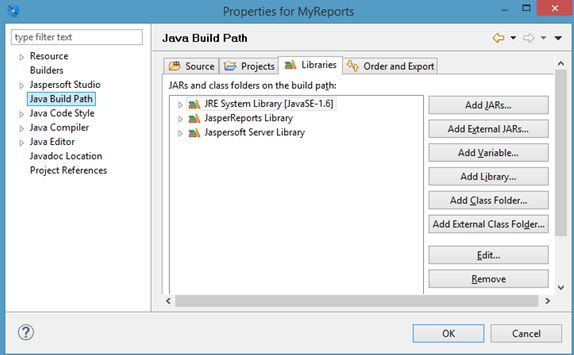
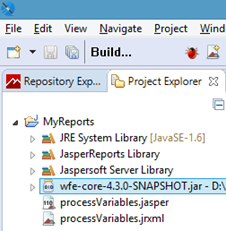
To use the ReportFormatter class you should add the following library into the project: File:Wfe-core-4.3.0-SNAPSHOT.jar
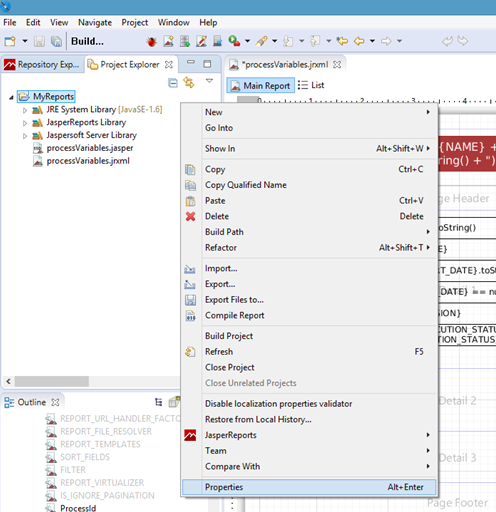
Open the project’s properties.
Highlight “Java Build Path”, then go to the Libraries tab.
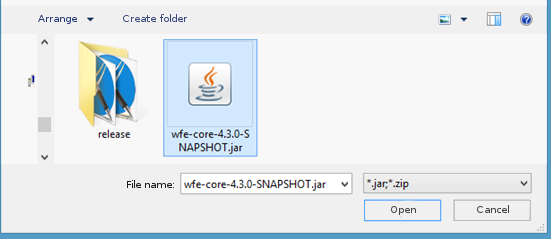
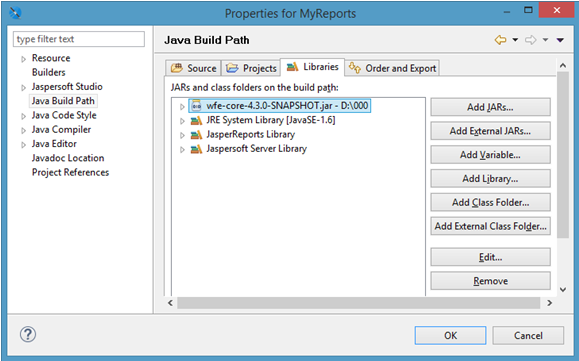
Press “Add External JARs” and select a jar file.
Now create a new parameter, name it DataFormatter and give it the ru.runa.wfe.report.ReportFormatter class.
Set the default value expression in the form of the following string:
new ru.runa.wfe.report.ReportFormatterImpl()
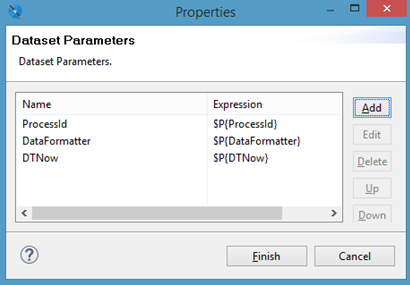
Return to the ProcessTasks dataset, open the parameters tab, add DTNow and DataFormatter.
# “Active Tasks” Table
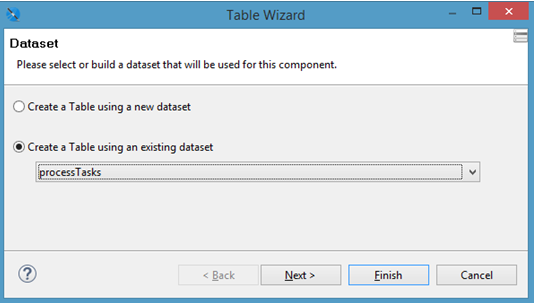
From the graphic elements palette add a table (Table element)
Use the “ProcessTasks” dataset you have created.
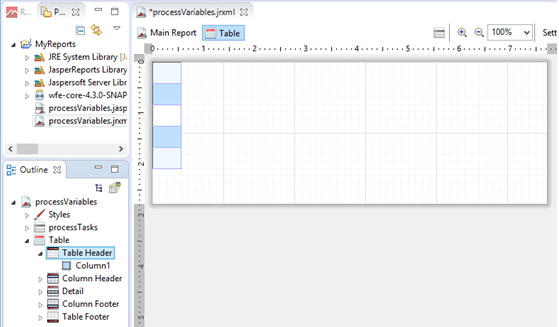
Double click the table to edit it.
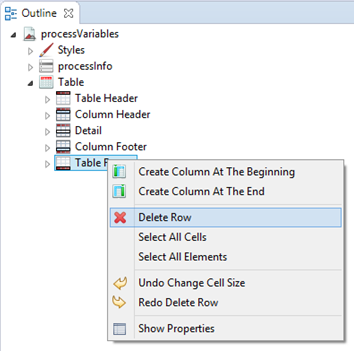
Highlight and delete “Column Footer” and “Table Footer” one after another.
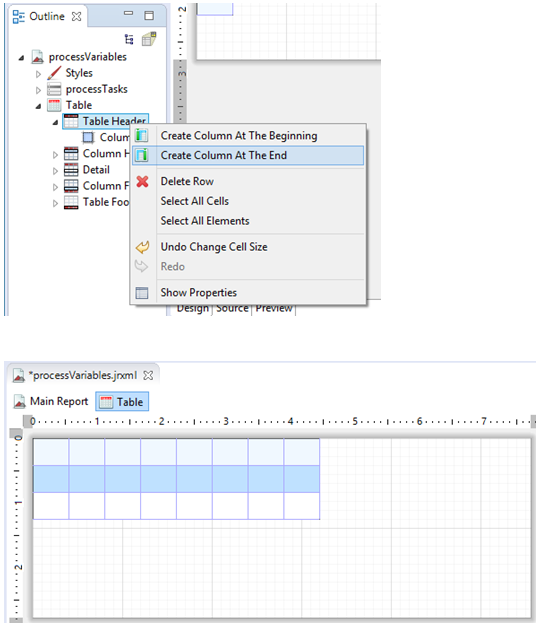
Create 8 columns
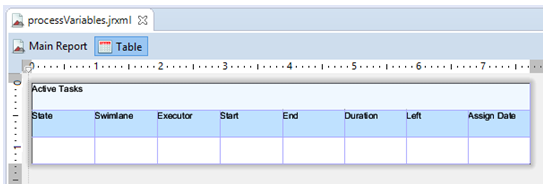
Group the columns in the heading and expand the acquired table over the whole area.
Position the “Static text” elements and enter the columns’ names.
In the value columns position the “Text Field” elements.
Use the following expressions for the fields:
- State
$F{TASK_NAME}
- Swimlane
$F{SWIMLANE_NAME}
- Executor
$F{EXECUTOR_NAME}
- Date of creation
$P{DataFormatter}.timeMultilineFormat().dateTime($F{CREATE_DATE})
- Date of deadline
$P{DataFormatter}.timeMultilineFormat().dateTime($F{DEADLINE_DATE})
- Actual duration
$P{DataFormatter}.timeMultilineFormat().interval($F{CREATE_DATE},$P{DTNow})
- Time until deadline
$P{DataFormatter}.timeMultilineFormat().interval($P{DTNow},$F{DEADLINE_DATE})
- Assignment date
$P{DataFormatter}.timeMultilineFormat().dateTime($F{ASSIGNMENT_DATE})
For Timestamp format fields the Data Formatter is used. It allows to convert the value into a display format common with RunaWFE. By means of interval method (StartDate, EndDate) an interval between the two specified dates is calculated.
The DTNow, DataFormatter and ProcessId parameters should be sent to the dataset of the "Active tasks" table.
# Table Styles
Along with a table styles are created automatically.
Edit them and apply to the title, cells with names of parameters, value cells.
# Swimlanes Information Section
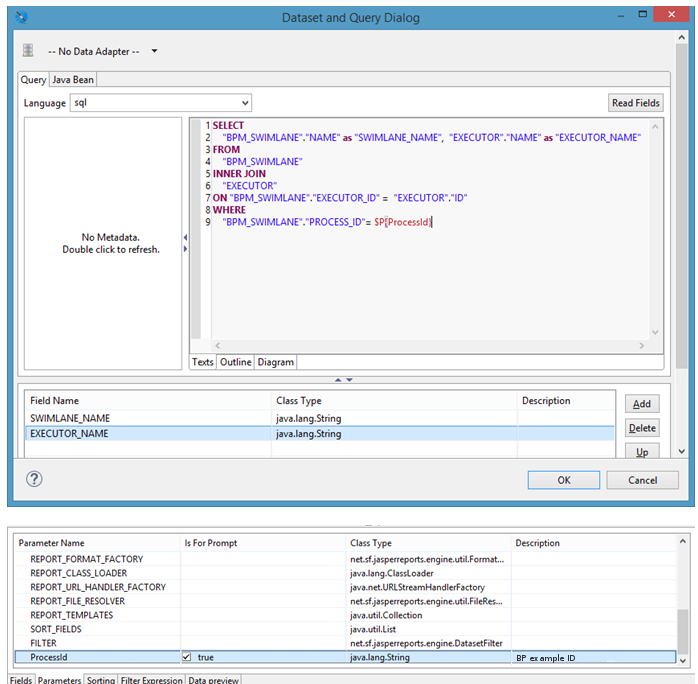
Create a new dataset “processExecutors”.
To obtain the swimlanes of a BP example use the following SQL query:
SELECT
       "BPM_SWIMLANE"."NAME" as "SWIMLANE_NAME",  "EXECUTOR"."NAME" as "EXECUTOR_NAME"
FROM
       "BPM_SWIMLANE"
INNER JOIN
       "EXECUTOR"
ON "BPM_SWIMLANE"."EXECUTOR_ID" =  "EXECUTOR"."ID"
WHERE
       "BPM_SWIMLANE"."PROCESS_ID"= $P{ProcessId}
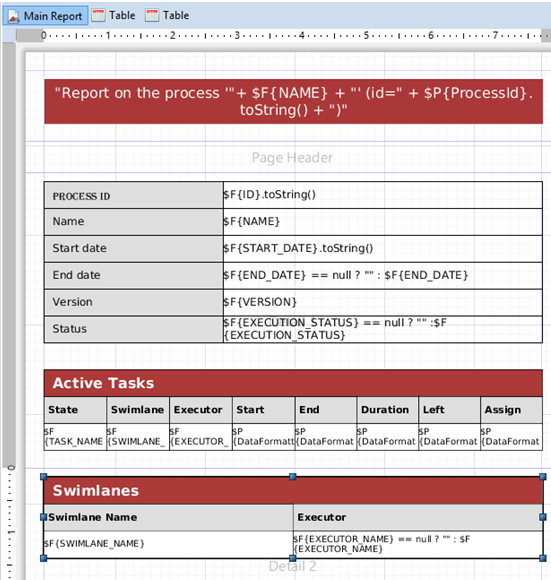
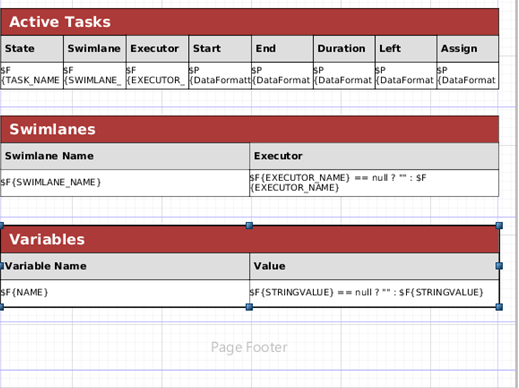
In the Detail2 band position the table to display swimlanes of the BP example, use processExecutors as a dataset.
Add the following expressions for the Swimlane and Executor fields:
$F{SWIMLANE_NAME}
$F{EXECUTOR_NAME} == null ? "" : $F{EXECUTOR_NAME}
Apply styles to the table.
# Table of Process Variables
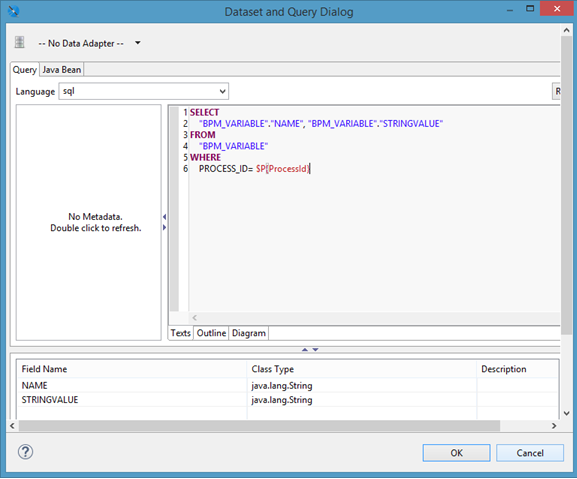
Create a new dataset to obtain values of variables of the BP example.
SELECT
       "BPM_VARIABLE"."NAME", "BPM_VARIABLE"."STRINGVALUE"
FROM
       "BPM_VARIABLE"
WHERE
        PROCESS_ID= $P{ProcessId}
Create a table to display values of variables of the BP example in a similar way to the swimlanes table and position it in the Detail3 band.
Use the following expressions for the "Variable Name" and "Value" fields:
$F{NAME}
$F{STRINGVALUE} == null ? "" : $F{STRINGVALUE}
In the footer of the report position two “Text Field” elements with expressions like:
"Page " + $V{PAGE_NUMBER}
" of " + $V{PAGE_COUNT}
where
- PAGE_NUMBER – number of the current page
- PAGE_COUNT – number of pages in the report
# Report Compilation
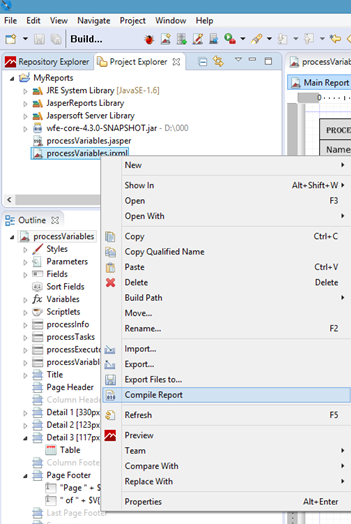
Select the report file (.jrxml extension), open the context menu and select “Compile Report”
If there are no errors in the report, a file with .jasper extension will be generated. You will be able to upload it to RunaWFE server.
# Report Deployment and Execution
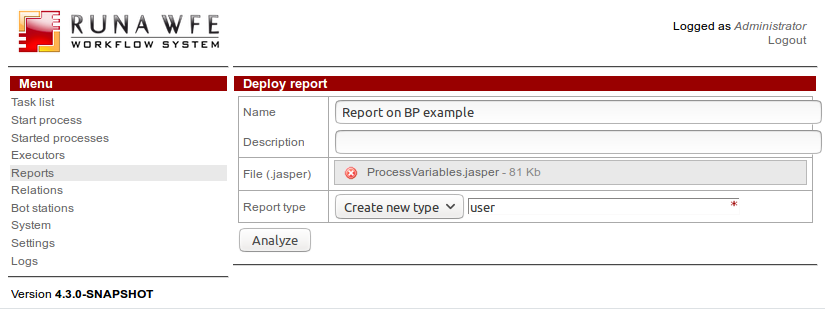
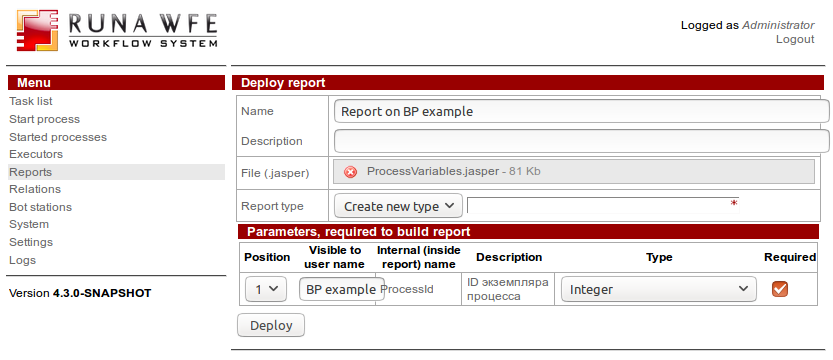
Open “Reports” and press Deploy.
Select a report file (.jasper extension) and fill in the required fields.
Press “Analyse”.
Enter visible to user name for the ProcessId parameter.
Select the Integer type, set the parameter as required.
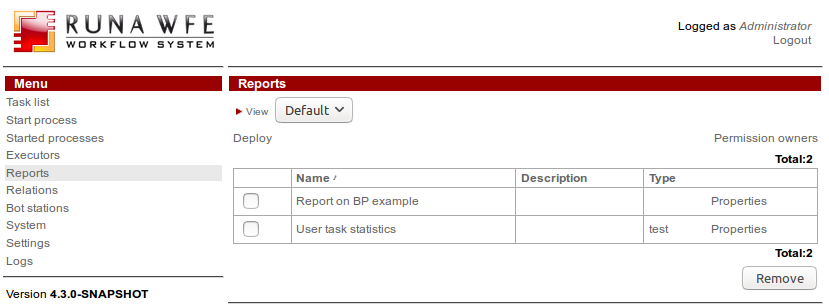
Press “Deploy”, the report will appear in the list.
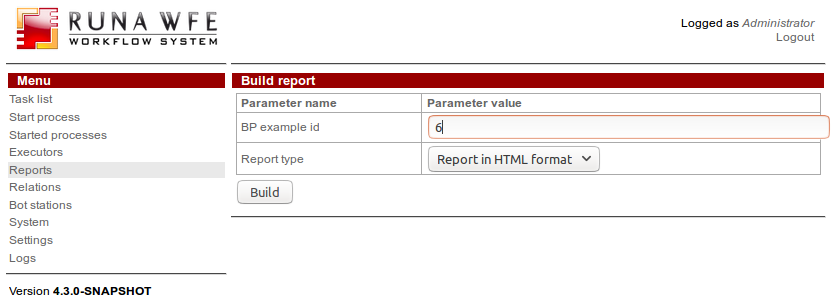
Execute the report:
Enter the id of the BP example you want to obtain the data on in the report and select the report type.
Press “Build”.
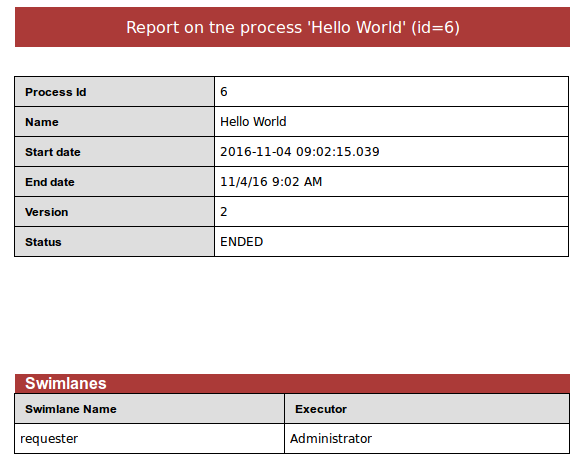
Below you can see the examples of built reports.
# Files of Reports on BP example data
To see an example of a report developed by means of the given guide follow the links below:
